This is a followup to !10524.

In addition I changed that the tooltip triggers for the whole height, instead for only the bar height, because otherwise it is esp for small bars nearly impossible to get the tooltip to open.

Reviewed-on: https://codeberg.org/forgejo/forgejo/pulls/10556
Reviewed-by: Gusted <gusted@noreply.codeberg.org>
Co-authored-by: Beowulf <beowulf@beocode.eu>
Co-committed-by: Beowulf <beowulf@beocode.eu>
Some Vue components were already lazy-loaded, but not all.

There are three main changes:
1. Move init scripts outside Vue code.
2. Make the init scripts lazy-load the Vue components.
3. Deal with vue linters, because apparently if you do `export default` then some Vue linters will notice that's vue sfc.

The rationale for this pull requests is that this reduces the size of the `index.js` file.
- Uncompressed: 1.24 MB -> 954.40 kB
- Compressed (gzip, via `reverse_proxy` of Caddy): 400.45 kB -> 298.95 kB
- Compressed (zstd, via `bindata` tag): 363.75 kB -> 274.22 kB

Reviewed-on: https://codeberg.org/forgejo/forgejo/pulls/9444
Reviewed-by: Otto <otto@codeberg.org>
Co-authored-by: Gusted <postmaster@gusted.xyz>
Co-committed-by: Gusted <postmaster@gusted.xyz>
- Regression of #4571
- We aren't showing the ticks generated by chartjs, because we want to
show the avatar of the person instead. You can't *realy* disable that
tick, so instead I opted to make them transparent in #4571, however they
still affected the generation of ticks so if enough authors were being
shown, for some the ticks were being skipped. Adjust the settings to
make sure they are always being shown.
- Resolves https://codeberg.org/forgejo/forgejo/issues/4982
- The usage of the `vue-bar-graph` is complicated, because of the `GSAP`
dependency they pull in, the dependency uses a non-free license.
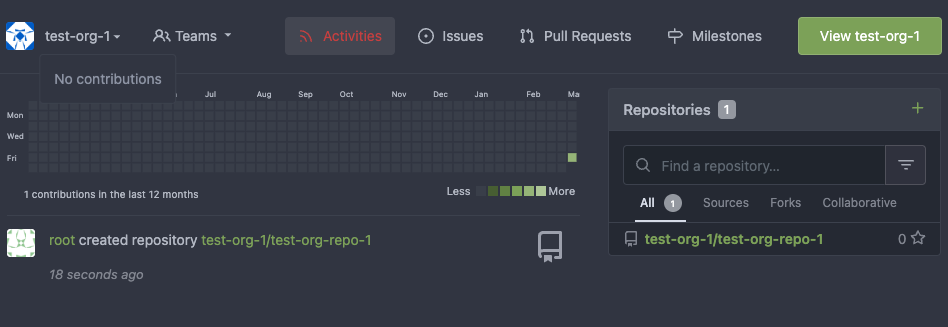
- The code is rewritten to use the `chart.js` library, which is already
used to draw other charts in the activity tab. Due to the limitation of
`chart.js`, we have to create a plugin in order to have images as labels
and do click handling for those images.
- The chart isn't the same as the previous one, once again simply due to
how `chart.js` works, the amount of commits isn't drawn anymore in the
bar, you instead have to hover over it or look at the y-axis.
- Resolves#4569
To keep blame info accurate and to avoid [changes like
this](https://github.com/go-gitea/gitea/pull/29977/files#diff-c3422631a14edbe1e508c4b22f0c718db318be08a6e889427802f9b6165d88d6R359),
it's good to always have a trailing comma, so let's enforce it in JS.
This rule is completely automatically fixable with `make lint-js-fix`
and that's what I did here.
(cherry picked from commit 3d751b6ec18e57698ce86b79866031d2c80c2071)
Conflicts:
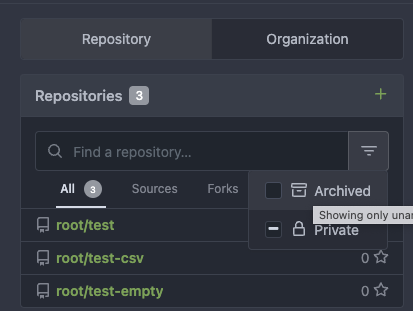
web_src/js/components/DashboardRepoList.vue
trivial context conflict because of '3b7b899afa fix commit_status'
The [recommended order](https://vuejs.org/guide/scaling-up/sfc.html) for
SFC blocks is script -> template -> style, which we were violating
because template and script were swapped. I do find script first also
easier to read because the imports are on top, letting me immideatly see
a component's dependencies.

This is a pure cut-paste refactor with some removal of some empty lines.

---------

Co-authored-by: Lauris BH <lauris@nix.lv>